The right side of the screen is dynamic: it displays everything that the system has calculated based on the selected parameters.
2.1 Daily AI / LLM Strategies
At the top, there are 4 cards from top LLM models:
-
Claude
-
GPT
-
Grok
-
DeepSeek
Each card displays:
-
the coin selected by the model,
-
trading pair,
-
the projected profitability (PnL %),
-
a Run button to launch the strategy.
This is a quick way to start trading "like an AI."
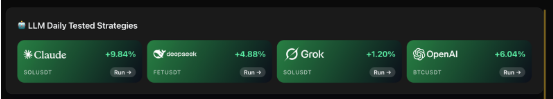
4 cards Strategy Setup from top LLM models screenshot
2.2 Backtest Results
Below is a block of backtest results for the current user strategy:
-
Total Trades
-
Win Rate
-
PnL (USDT)
-
PnL (%)
-
Average Profit per Trade
All values are updated instantly when you change the parameters on the left.
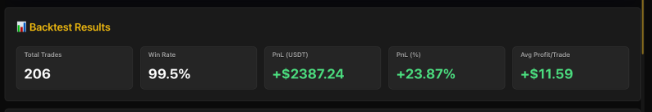
gt-app backtest results screenshot
2.3 Backtest Chart
The chart shows:
-
all strategy entry and exit points (buy/sell orders)
-
visualisation of the short or long trend, if the setting is enabled.
The most important element in this block is the button “Launch Trading”.

gt-app backtest Chart screenshot
Launch Strategy
Once users have:
-
configured the parameters,
-
optimized the strategy,
-
seen a suitable result on the chart
Once they click Launch Trading, all configured data will be automatically transferred to their GT-App, so there is no need to re-enter anything manually - everything will appear on the screen instantly.
(A registered GT-App account and an active exchange connection are required to launch.)